ISEC Pedestrian Bridge Vibration Analysis
Fall 2025
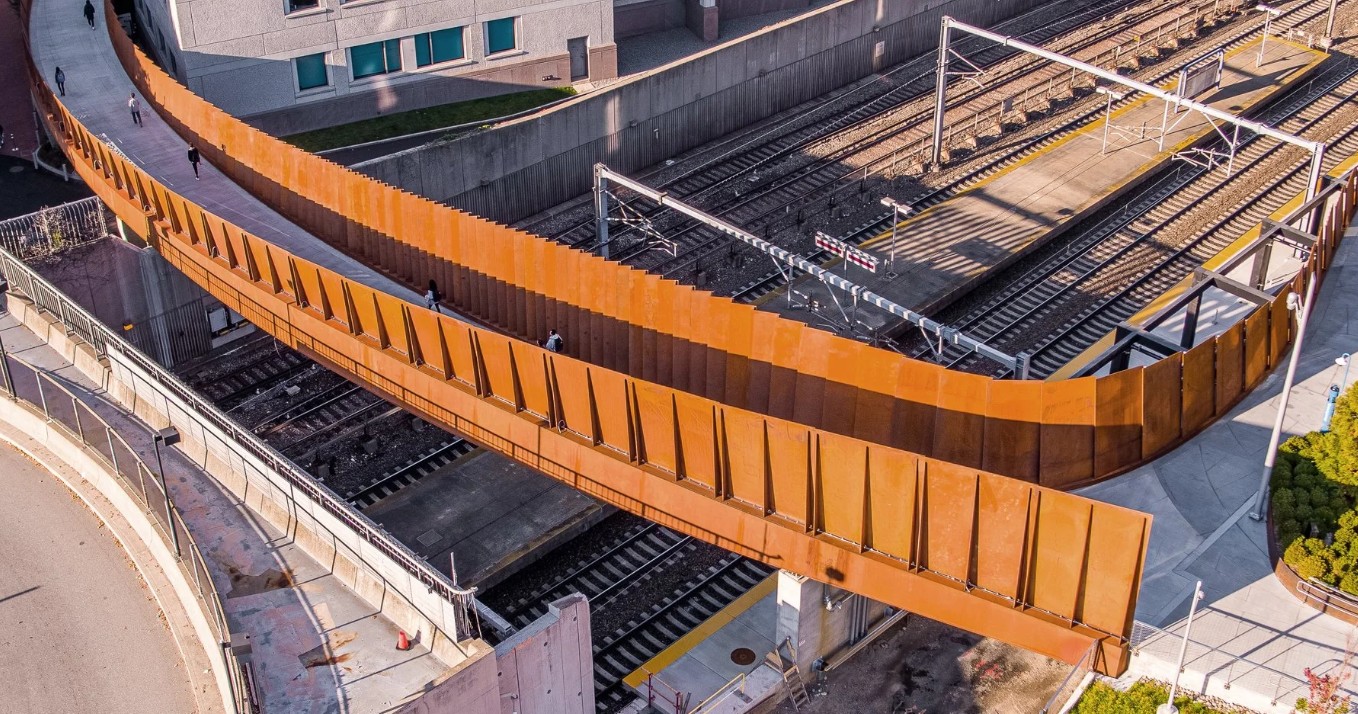
Role
Team of three
Quinn Morris: test planning, data collection, resonance and uncertainty analysis
Description
A term project for my ME 4505 class measuring how the ISEC pedestrian bridge responds to the trains running beneath it. Acceleration recorded at midspan during Orange Line, Commuter Rail, and simultaneous crossings was transformed to the frequency domain to identify the natural frequency of the structure and estimate peak displacement.
Overview
Background
The ISEC pedestrian bridge at Northeastern is a 500 ft steel box-girder structure spanning five active rail tracks, so it takes repeated dynamic loading from the Orange Line, Commuter Rail, and Acela every day. The project set out to identify the natural frequency of the bridge, determine which train excites it most, and assess whether the response approaches resonance.
Method
An accelerometer logged vertical acceleration at approximate midspan across four scenarios: Orange Line, Commuter Rail, Acela, and both mainline trains passing simultaneously. Recording started roughly 30 seconds before each train arrived and ran until 30 seconds after, with video taken alongside so every dataset could be matched to the train that produced it. The signals were detrended to remove the static gravity offset, converted to m/s², and transformed with an FFT in MATLAB.
Result
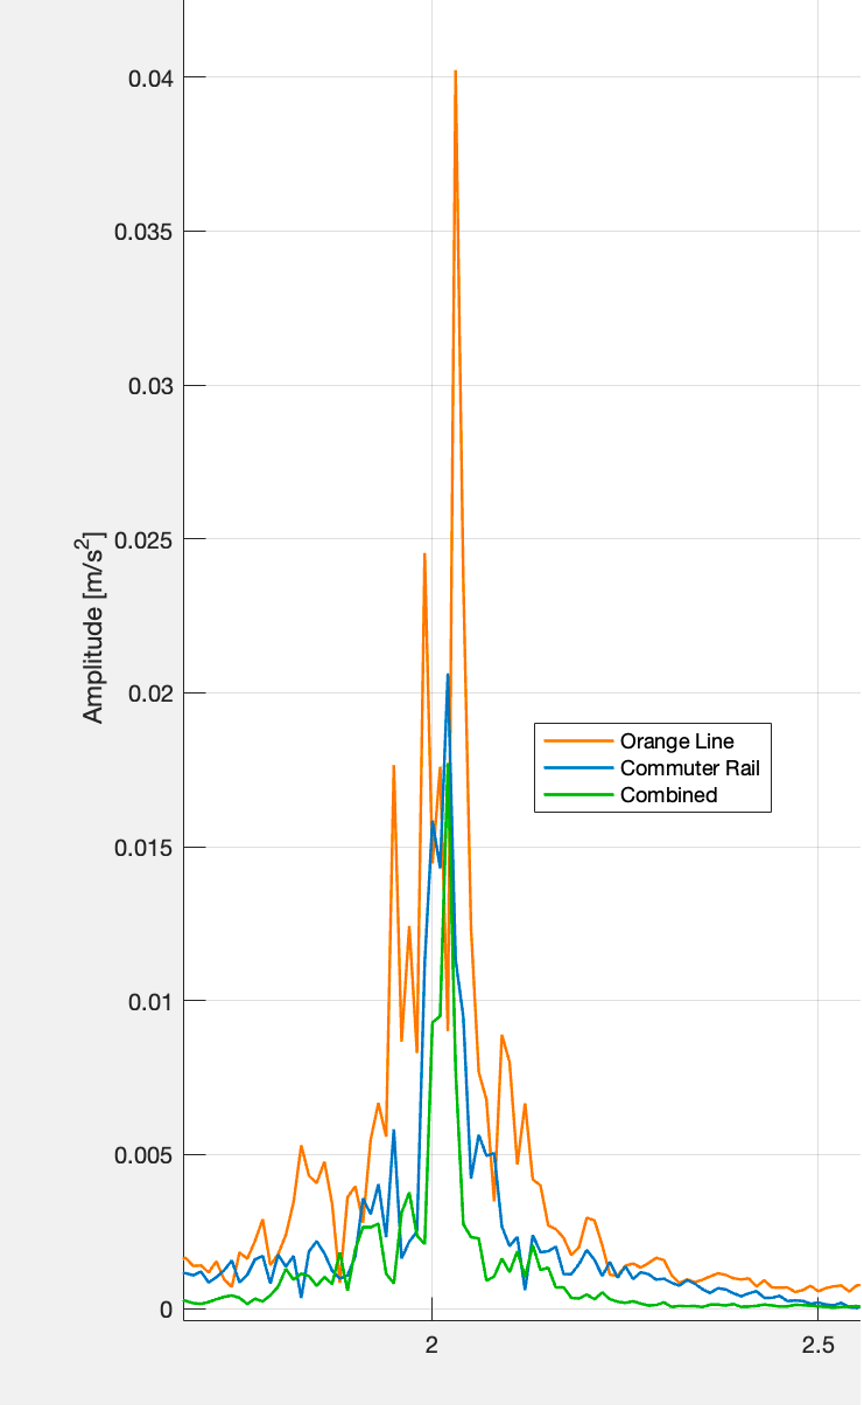
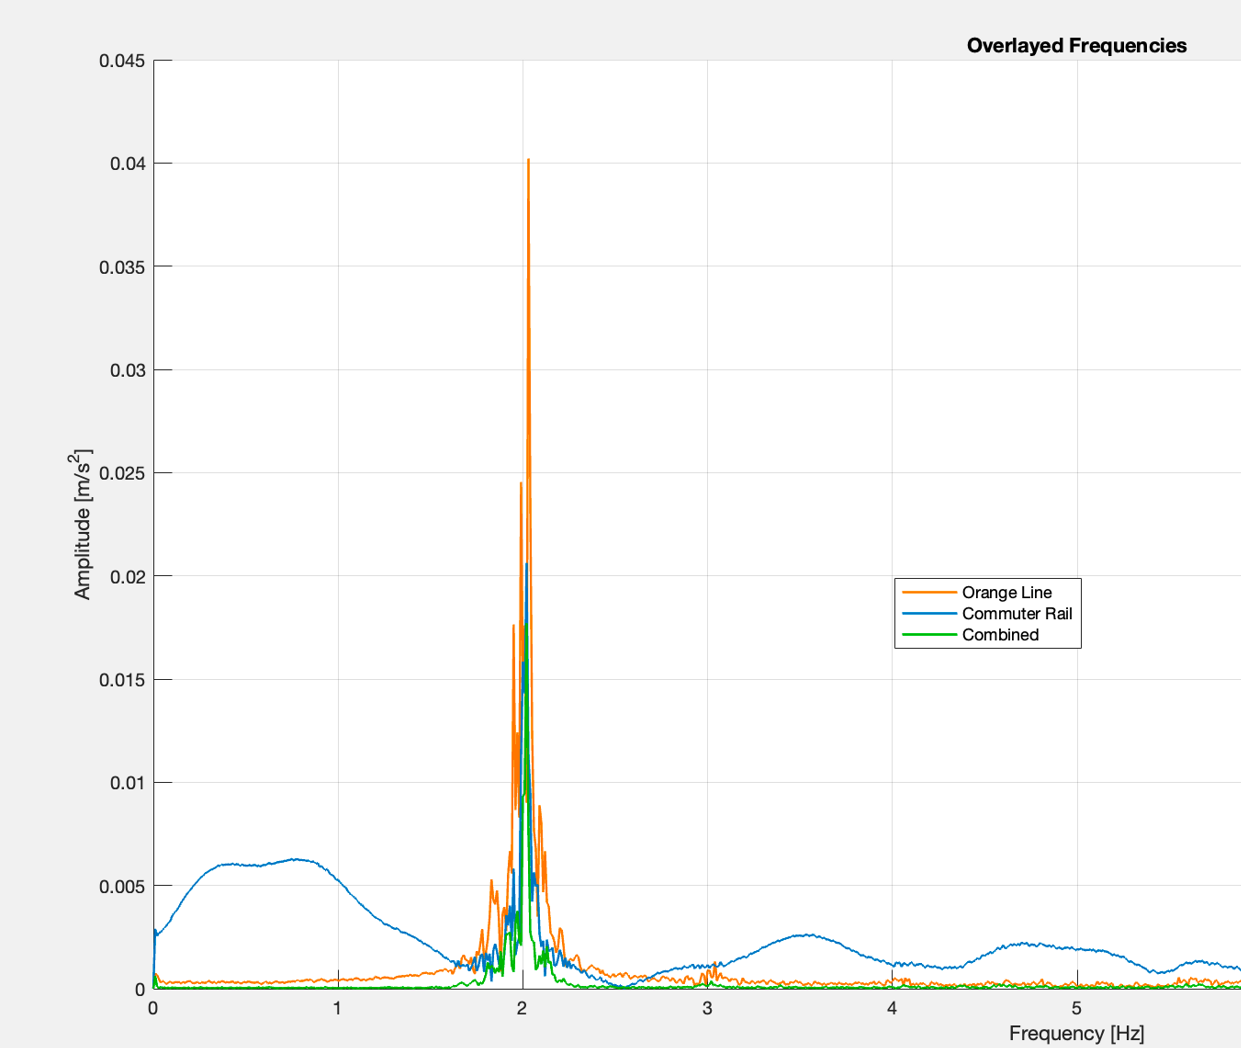
All three usable datasets peaked near 2 Hz, identifying that as the natural frequency of the bridge. The Orange Line drove the largest response at 0.0409 m/s², roughly 0.26 mm of midspan displacement. Every scenario stayed under 0.3 mm, comfortably inside elastic limits.
Choosing an instrument that could see the signal
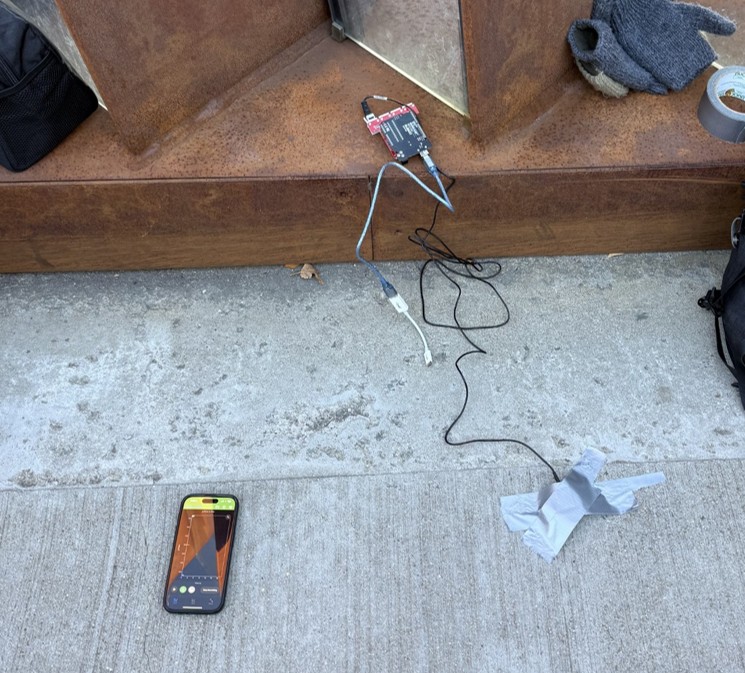
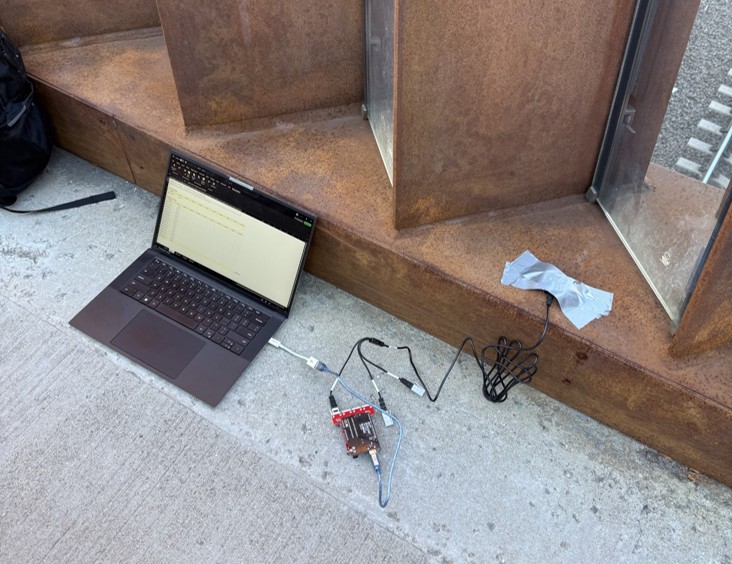
The first setup paired a Vernier ±5 g accelerometer with an Arduino RedBoard, and the logged values only ever moved between three numbers. This is becuase its a 10-bit ADC splitting a 98 m/s²full-scale range gives 0.096 m/s² per step, and the vibrations in the bridge were smaller than a single step.
Swapping in a low-g single-axis sensor changed nothing, which confirmed the converter rather than the sensor was the limit. The final setup dropped the external hardware entirely for an iPhone 15 Pro running Physics Toolbox, whose higher-resolution ADC produced a continuous signal and exported straight to CSV.
Which train excites the bridge most
Peak acceleration within ±0.15 Hz of 2 Hz was extracted for each run and converted to displacement. The Orange Line came out highest at 0.0409 m/s² and 0.259 mm, with the Commuter Rail close behind at 0.0364 m/s² and 0.231 mm.
The counterintuitive result was the combined case: both trains at once produced the smallest response, 0.0214 m/s² and 0.136 mm. The two lines run on opposite sides of the midspan, so they induce bending moments of opposite sign and their waves reach the sensor out of phase. More energy entered the structure, but less of it showed up at the measurement point.
The Acela was recorded as well, but its excitation never rose above the noise floor from wind and foot traffic, so that trial was discarded.
What the displacements say about fatigue
Every measured displacement stayed under 0.3 mm, which keeps stress cycles low and fatigue accumulation minimal. Excitation near the natural frequency is not a problem in itself when the resulting amplitude is this small.
Natural frequency ties directly to stiffness, so with mass effectively constant, a downward drift in that 2 Hz peak over years would point to stiffness loss from fatigue, loosening connections, or material degradation. If this measurement was repeatedperiodically, the 2 Hz peak could serve as a structural health monitoring baseline.
Uncertainty and what limited it
The Vernier units carried a stated accuracy of ±0.5 m/s², which is the figure the error analysis was built on. The accelerometer specifications for the iPhone are proprietary, so no formal uncertainty could be calculated for the final setup. Both are MEMS devices, so comparable accuracy was assumed and reported as an assumption rather than a result.
Wind gusts and passing pedestrians added acceleration that no control could separate out, the phone did not sit perfectly flat on the deck, and the curvature of the bridge meant midspan was estimated rather than measured. The non-uniform cross-section also means damping varies along the span.